scanpath_visualization
- eyefeatures.visualization.static_visualization.scanpath_visualization(data_, x, y, shape_column=None, aoi=None, img_path=None, fig_size=(10.0, 10.0), points_width=75, path_width=0.004, points_color='blue', path_color='green', points_enumeration=False, add_regressions=False, regression_color='red', is_vectors=False, aoi_c=None, only_points=False, seq_colormap=False, show_hull=False, show_legend=False, path_to_img=None, with_axes=False, axes_limits=None, rule=None, deviation=None, return_ndarray=False, show_plot=True, is_gray=False, dpi=100.0)[source]
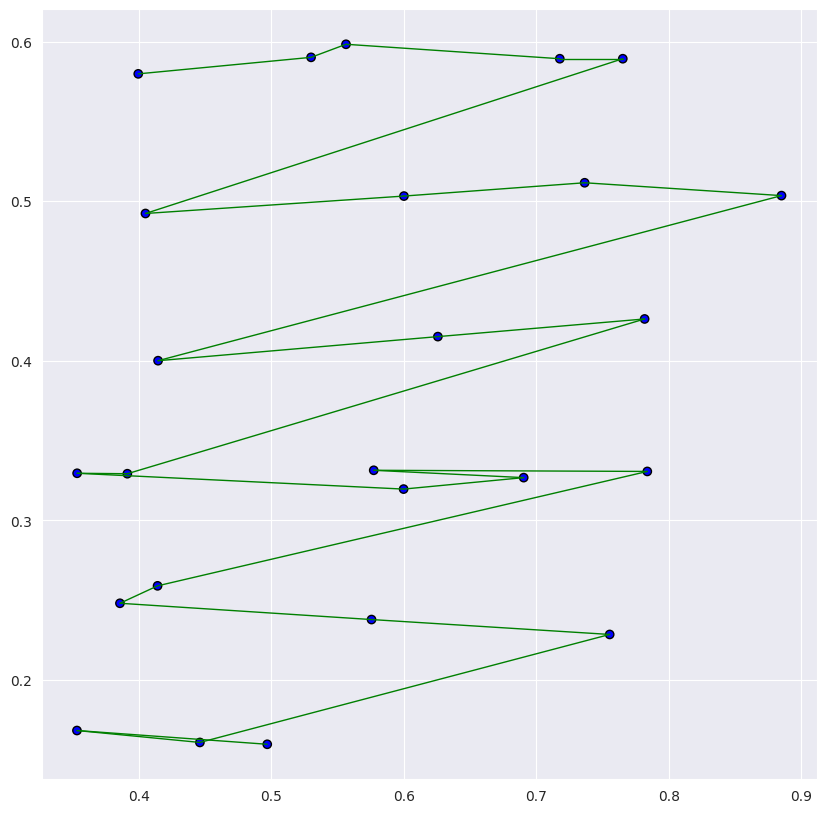
Function for scanpath and/or aoi visualization.
- Parameters:
data – DataFrame with fixations.
x (str) – x coordinate of fixation.
y (str) – y coordinate of fixation.
size_column –
label of the column, which is responsible for the size of the fixations(points on plot).
It can be duration, dispersion, etc.
shape_column (str) – label of the column, which is responsible for the shape of the fixations(points on plot).
aoi (str) – AOI of fixations.
img_path (str) – path to the background image.
points_width (float) – width of points.
path_width (float) – width of path.
points_color (str) – color of points.
path_color (str) – color of path.
points_enumeration (bool) – whether to enumerate points.
add_regressions (bool) – whether to add regressions.
regression_color (str) – color of regressions.
is_vectors (bool) – whether to visualize saccades as vectors
only_points (bool) – whether to only show points.
seq_colormap (bool) – whether to show sequentially-colored saccades.
show_hull (bool) – whether to show hull of AOI.
show_legend (bool) – whether to show legend.
path_to_img (str) – path to save the plot image.
with_axes (bool) – whether to show axes.
axes_limits (tuple) – limits of axes.
rule (tuple[int, ...]) – must be either 1) tuple of quadrants direction to classify regressions, 1st quadrant being upper-right square of plane and counting anti-clockwise or 2) tuple of angles in degrees (0 <= angle <= 360).
deviation (int | tuple[int, ...]) – if None, then rule is interpreted as quadrants. Otherwise, rule is interpreted as angles. If integer, then is a +-deviation for all angles. If tuple of integers, then must be of the same length as rule, each value being a corresponding deviation for each angle. Angle = 0 is positive x-axis direction, rotating anti-clockwise.
return_ndarray (bool) – whether to return numpy array of the plot image (returns RGBA array).
show_plot (bool) – whether to show the plot.
is_gray (bool) – whether to use the gray scale.
dpi (float) – dpi for output image.
data_ (DataFrame)
Usage Example
import pandas as pd

from eyefeatures.visualization.static_visualization import scanpath_visualization

data = pd.read_csv("<your_data>.csv")  # read your dataframe
x = "fixation_x"
y = "fixation_y"

scanpath_visualization(data, x, y, return_ndarray=False, with_axes=True, path_width=1)