scanpath_animation
- eyefeatures.visualization.dynamic_visualization.scanpath_animation(data_, x, y, path_color='green', path_width=0.5, points_color='black', points_width=6, add_regression=False, regression_color='red', rule=None, deviation=None, animation_duration=500, save_gif=None, frames_count=1)[source]
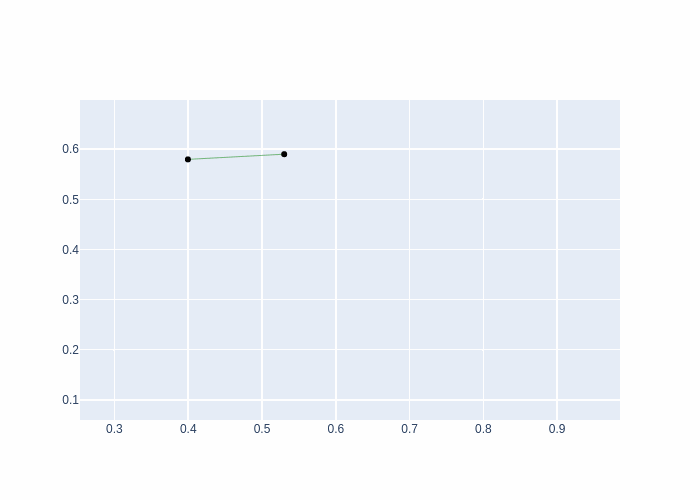
Function for tracker animation.
- Parameters:
data – DataFrame with fixations.
x (str) – x coordinate of fixation.
y (str) – y coordinate of fixation.
path_color (str) – color of saccades.
path_width (float) – width of saccades.
points_color (str) – color of points.
points_width (float) – width of points.
add_regression (bool) – whether to add regressions.
regression_color (str) – color of regressions.
rule (tuple[int, ...]) – must be either 1) tuple of quadrants direction to classify regressions, 1st quadrant being upper-right square of plane and counting anti-clockwise or 2) tuple of angles in degrees(0 <= angle <= 360).
deviation (int | tuple[int, ...]) – if None, then rule is interpreted as quadrants. Otherwise, rule is interpreted as angles. If integer, then is a +-deviation for all angles. If tuple of integers, then must be of the same length as rule, each value being a corresponding deviation for each angle. Angle = 0 is positive x-axis direction, rotating anti-clockwise.
animation_duration (int) – duration of animation.
save_gif (str) – path to save animation.
frames_count (int) – TODO.
data_ (DataFrame)
Usage Example
import pandas as pd

from eyefeatures.visualization.dynamic_visualization import scanpath_animation

# read data and define column names
data = pd.read_csv("<your_data>.csv")  # read your dataframe
x = "fixation_x"
y = "fixation_y"
aoi = "fixation_AOI"
duration = "fixation_duration"

# extract a single object from data
record = data[data["OBJECT_ID"] == 0]  # example

# get scanpath animation of OBJECT_ID=0
scanpath_animation(
    record,
    x=x,
    y=y,
    add_regression=True,
    rule=(2,),
    animation_duration=500,
    save_gif="scanpath.gif",
)